UWP apps can be launched in a myriad of different ways including tiles, triggers, prelaunch and more. We must make sure all these paths are running smoothly, and Visual Studio is here to help us debug those.
Launch for debugging
The most basic way to run your app for debugging is to launch it from Visual Studio - Debug - Start Debugging... (F5). App goes through the standard launch lifecycle (OnLaunched override in Application class).
Lifecycle events & background tasks
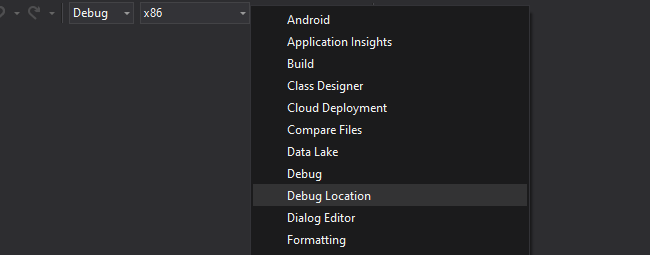
To debug lifecycle events of a running app and to trigger registered background tasks, you can use the Debug location toolbar. The toolbar is not shown by default, but there are several ways to display it. You can go to View - Toolbars - Debug Location or use a shortcut by right-clicking empty space in the upper (toolbar) area of Visual Studio:
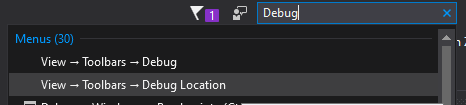
My preferred way is to use the Quick Launch search box (Ctrl + Q) located in the top right corner of Visual Studio window. Here we can type "debug" and press Enter, and the Debug Location option should be listed there. Moreover, if we type "debug location" in full and confirm, the option will be toggled directly.
The Debug Toolbar is quite powerful and not only for UWP apps, but we will focus on the Lifecycle Events menu:
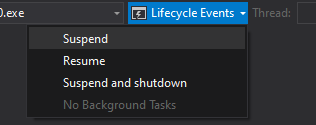
The menu allows us to trigger Suspend, Resume, and Suspend and shutdown events for our app. Be aware that after you Suspend, the app window will become nonresponsive until you Resume it again. If you have some registered background tasks, those are listed in the menu as well, so you can select and debug them.
Debug when started
A particularly interesting option Visual Studio allows is to start the debugger and automatically attach it once the app starts. We can set this up by right-clicking your UWP project in Solution Explorer, selecting Properties and switching to the Debug tab. Here we find Start action setting group which contains a Do not launch, but debug my code when it starts checkbox.
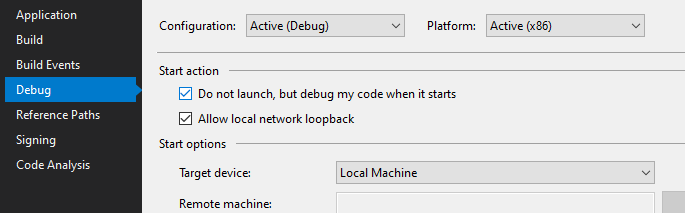
Once we enable this option and start debugging (F5), Visual Studio will switch into debugging mode, but app will not start. This is your chance to launch the application the way you intend to debug - for example using file association or via custom URI scheme. Debugger will automatically attach when that happens, so you can set breakpoints and step through the app activation code for example. I highly recommend you to turn this option off when you are done debugging though, as it is quite easy to forget it and then be quite surprised that your app is not launching next week :-) .
Attach to process
Another great thing Visual Studio offers is to attach to an already running instance of an app from the Debug - Attach to Process... dialog.
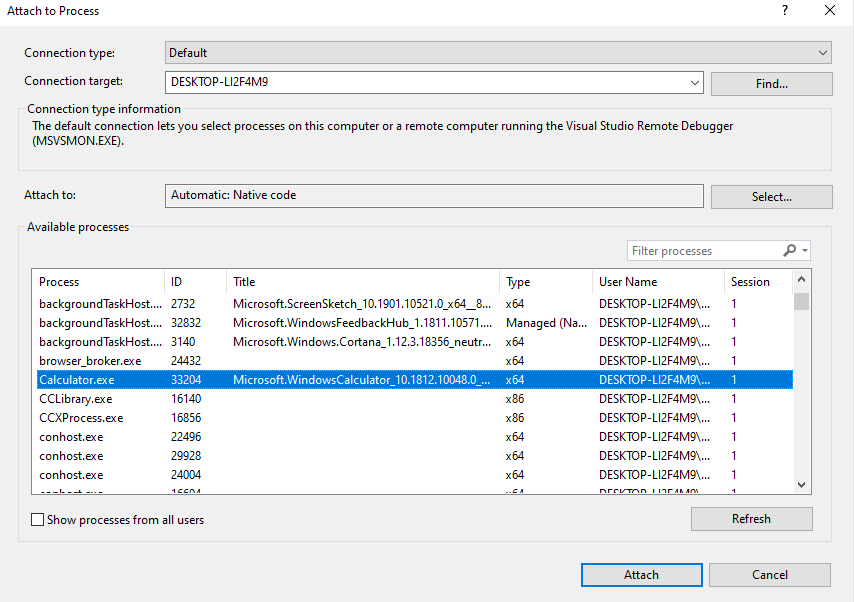
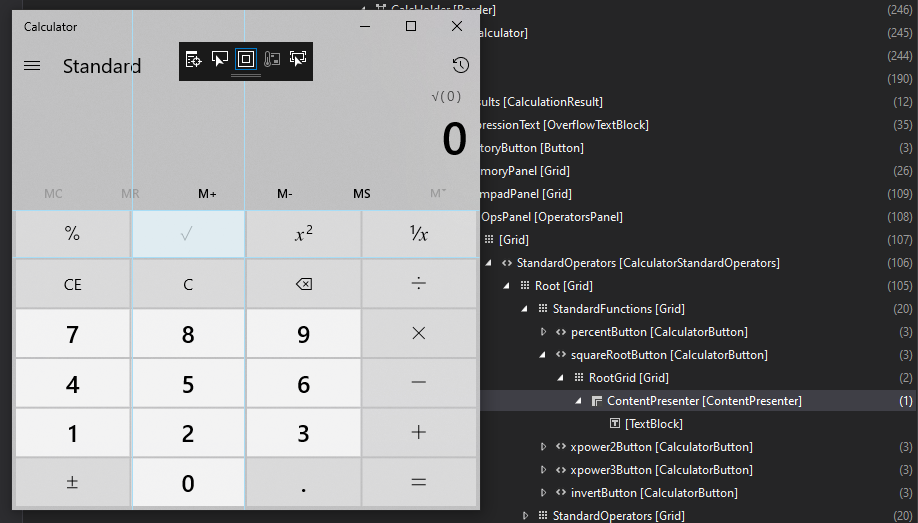
You can select a process running on your machine (not limited to UWP) or a remote machine by virtue of Visual Studio Remote Debugger. The coolest thing about this is that attached debugger enables the XAML debugging toolbar in the app, and you can then inspect the running app using the XAML Live Visual Tree and Live Property Explorer windows - even for apps downloaded from Microsoft Store! In this example, I am using the Windows Calculator app, although that is open source now anyway :-) .
Other debug targets
Finally, I would also like to briefly mention three additional ways of debugging your UWP app lifecycle that are available in the Debug - Other Debug Targets menu:
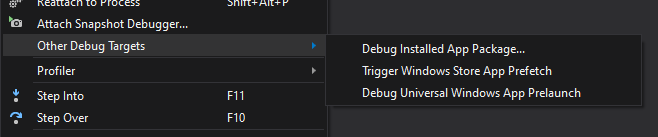
From top to bottom the options are:
Debug Installed App Package - allows us to start an app package installed on our PC for debugging. The dialog offers us advanced options which include code type to debug, attaching debugger without starting (see above), debugging app prelaunch (see below) and stopping debugger at first statement.
[caption id="attachment_1701" align="aligncenter" width="610"]
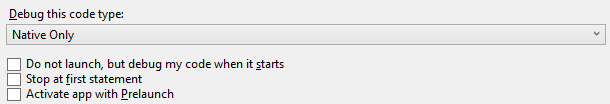 Debugging installed app package[/caption]
Trigger Windows Store App Prefetch - I am actually not certain of how Windows Store App Prefetch works. It seems to be there since Visual Studio 2013, and Windows 8.1 days (including the name which still features the old Windows Store name) There seems to be no up-to-date documentation of it and most information about it is in Azure DevOps blog post from 2014. If you know more, please let me know, and I will update this with more information.
Debug Universal Windows App Prelaunch - this feature allows us to debug a special opt-in lifecycle event that allows the system to preload our app in the background so that it launches more quickly when the user decides to use it. OS decides when the prelaunch executes so this is the only way you can debug it and see how it performs. For more information, please check out this Microsoft Docs article which goes into detail about this feature.
Summary
Thanks to Visual Studio we have a many tools for debugging UWP apps at our disposal. These help us test all app lifecycle events and make sure our app behaves appropriately.